Unreal Engine – Player Electricity System v5.3
Player Electricity System
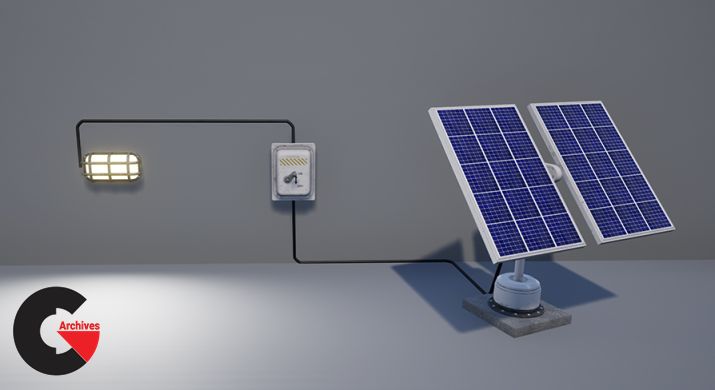
Player Electricity System : The Player Electricity System is the fast and easy way to add multiplayer electricity system to your projects! It includes extensive customization options, 17 electrical devices as well as an advanced placement system that allows for snapping and non-snapping placement of devices and cables. The power info panel UI is clean, easy-to-read, and can be customized using Unreal’s widget system. Many other features are included which you can find listed below!
Works with Unreal Engine 5!
Features:
Multiplayer Support
Device Stats (Health, Generated Power, Required Power, Stored Power, Battery Input, Battery Output)
Cable Placement
Destruction Effect
Directional Power (Power Input & Output sockets)
Power Splitter & Combiners
17 Included Devices
Placement Menu
Ownership
Repair, Pickup and Delete Devices
Save System (Does not support World Composition)
Socket and Non Socket placement
Power Generators (Wind Turbine, Generator & Solar Panel)
Switches (Pressure Plate, Switch & Laser Detector)
Batteries (Car Battery, Large Battery & Medium Battery)
Flamethrower Trap
Resources
Respawn System
First/Third Person Camera
Commented Code, Tool-tips and Documentation
Number of Blueprints: 56
Input: Mouse & Keyboard
Network Replicated: Yes
Supported Development Platforms: Windows, Mac
Important/Additional Notes: UE4 – Enabled APEX Destruction plugin | UE5 – Enabled Enhanced Input plugin
Direct download links 534 MB :

Direct download link reserved for subscribers only This VIP
Dear user to download files, please subscribe to the VIP member
- To activate your special membership site, just go to this link and register and activate your own membership . >>>register and activate<<<
- You can subscribe to this link and take advantage of the many benefits of membership.
- Direct downloads links
- No ads No waiting
- Download without any limitation ، all content in website
CGArchives Is The Best
Review
Review
Rate this post